Swift/BAT sources with interesting possible outbursts
Please Read Before Using These Results:README
Main page
|
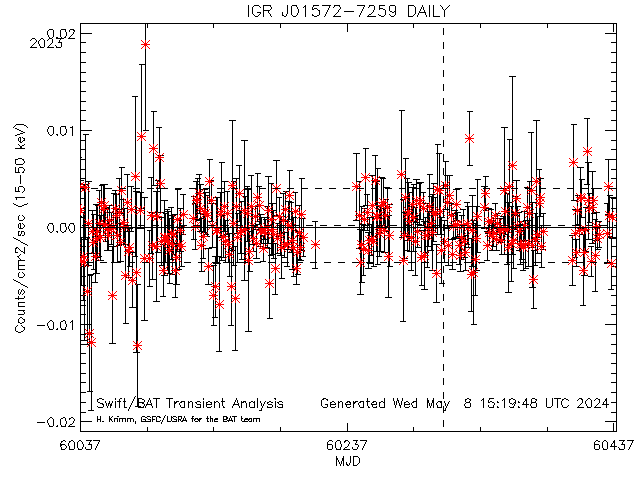
 Dashed lines show average rate (and +/- 1 sigma standard deviation) for this source (derived from this plot)
Daily light curves: FITS version ASCII version Orbit light curves: FITS version ASCII version
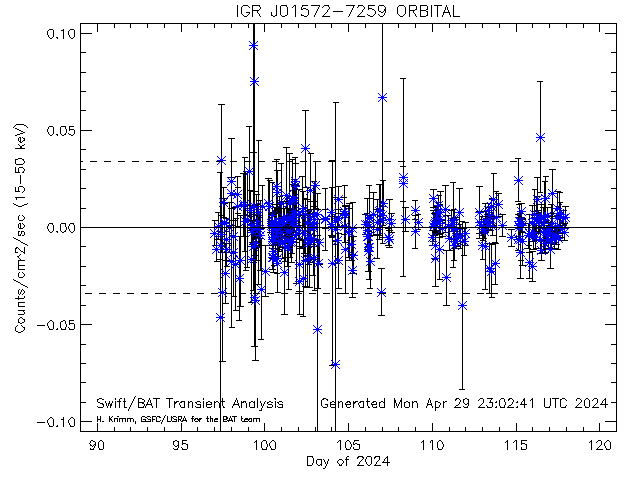
Dashed lines show average rate (and +/- 1 sigma standard deviation) for this source (derived from this plot)
Daily light curves: FITS version ASCII version Orbit light curves: FITS version ASCII version
FLAG (POINTING)--IGRJ01572-7259
IGR J01572-7259 [34114] RA= 29.3170 degs; Dec= -72.9760
mean: 0.000337 sdev: 0.030485 thresh: 0.029586 max: 0.029586
--SCALED MAP--(1.00000/32.0000)=(3.12500)--3-SIGMA=(0.13)--------------------------
Possible outbursts for IGR J01572-7259
| |
Count |
UTC Date |
Duration |
Rate |
Error |
Factor |
SNR |
mCrab |
Pcodefr |
MET |
| POINTING |
0 |
2026: 72: 6: 5: 4 |
192.00000 |
0.063194921 |
0.014732263 |
2.1359589 |
4.2895596 |
277.17070 |
0.25390625 |
795074704 |
|
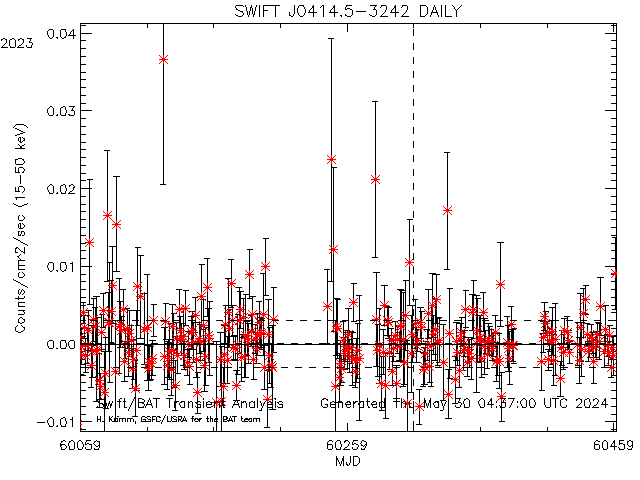
 Dashed lines show average rate (and +/- 1 sigma standard deviation) for this source (derived from this plot)
Daily light curves: FITS version ASCII version Orbit light curves: FITS version ASCII version
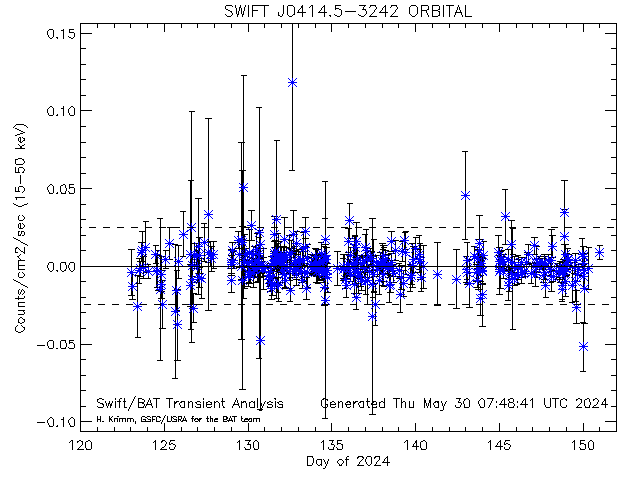
Dashed lines show average rate (and +/- 1 sigma standard deviation) for this source (derived from this plot)
Daily light curves: FITS version ASCII version Orbit light curves: FITS version ASCII version
FLAG (POINTING)--SWIFTJ0414.5-3242
SWIFT J0414.5-3242 [33931] RA= 63.6480 degs; Dec= -32.7140
mean: 0.000038 sdev: 0.025860 thresh: 0.053874 max: 0.053874
--SCALED MAP--(1.00000/30.0000)=(3.33333)--3-SIGMA=(0.13)--------------------------
Possible outbursts for SWIFT J0414.5-3242
| |
Count |
UTC Date |
Duration |
Rate |
Error |
Factor |
SNR |
mCrab |
Pcodefr |
MET |
| POINTING |
0 |
2026: 71: 3:39:12 |
192.00000 |
0.10586829 |
0.026164942 |
1.9651221 |
4.0461886 |
464.33459 |
0.11230469 |
794979552 |
|
 Dashed lines show average rate (and +/- 1 sigma standard deviation) for this source (derived from this plot)
Daily light curves: FITS version ASCII version Orbit light curves: FITS version ASCII version
Dashed lines show average rate (and +/- 1 sigma standard deviation) for this source (derived from this plot)
Daily light curves: FITS version ASCII version Orbit light curves: FITS version ASCII version
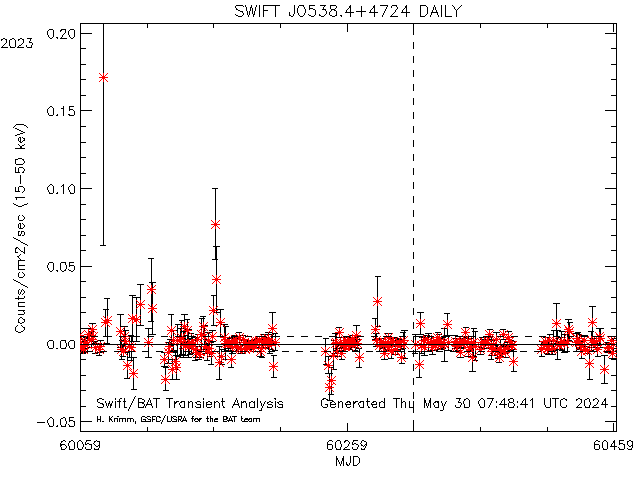
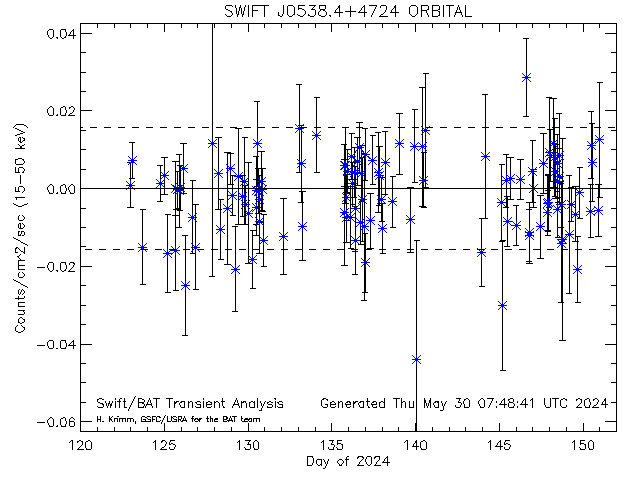
FLAG (POINTING)--SWIFTJ0538.4+4724
SWIFT J0538.4+4724 [33994] RA= 84.6130 degs; Dec= 47.4020
mean:-0.000028 sdev: 0.016758 thresh: 0.050247 max: 0.171260
--SCALED MAP--(1.00000/59.0000)=(1.69492)--3-SIGMA=(0.13)--------------------------
Possible outbursts for SWIFT J0538.4+4724
| |
Count |
UTC Date |
Duration |
Rate |
Error |
Factor |
SNR |
mCrab |
Pcodefr |
MET |
| POINTING |
0 |
2026: 71: 5:53:36 |
192.00000 |
0.061182039 |
0.013458456 |
1.2176174 |
4.5459925 |
268.34227 |
0.22070312 |
794987616 |
|
 Dashed lines show average rate (and +/- 1 sigma standard deviation) for this source (derived from this plot)
Daily light curves: FITS version ASCII version Orbit light curves: FITS version ASCII version
Dashed lines show average rate (and +/- 1 sigma standard deviation) for this source (derived from this plot)
Daily light curves: FITS version ASCII version Orbit light curves: FITS version ASCII version
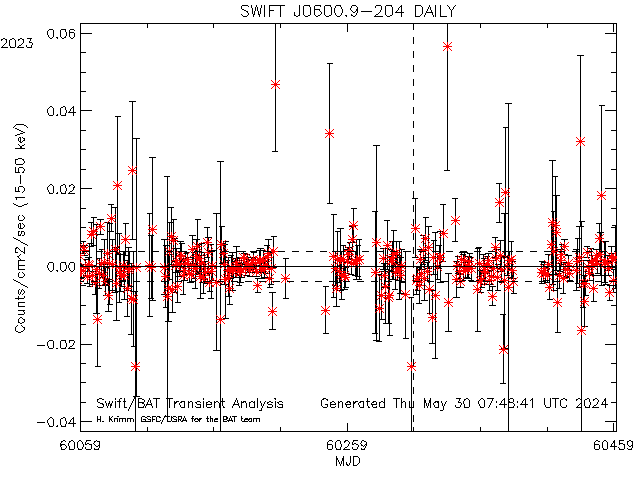
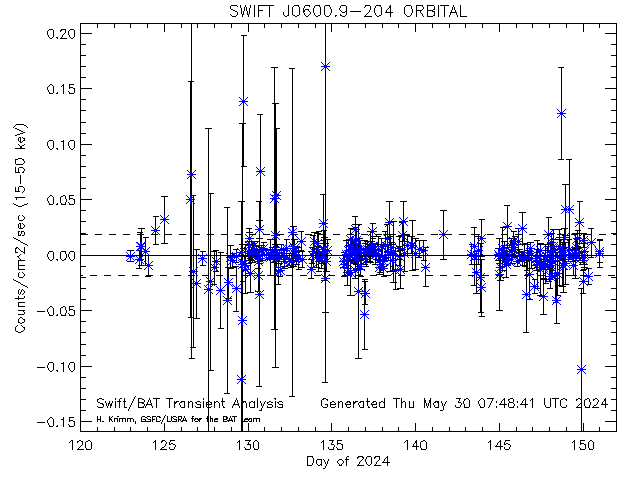
FLAG (POINTING)--SWIFTJ0600.9-204
SWIFT J0600.9-204 [33582] RA= 90.2192 degs; Dec= -2.06420
mean:-0.000015 sdev: 0.019498 thresh: 0.058478 max: 0.058750
--SCALED MAP--(2.00000/51.0000)=(3.92157)--3-SIGMA=(0.13)--------------------------
Possible outbursts for SWIFT J0600.9-204
| |
Count |
UTC Date |
Duration |
Rate |
Error |
Factor |
SNR |
mCrab |
Pcodefr |
MET |
| POINTING |
0 |
2026: 71:14:10:48 |
192.00000 |
0.070593130 |
0.020934055 |
1.2071773 |
3.3721671 |
309.61898 |
0.16601562 |
795017448 |
| POINTING |
1 |
2026: 71:17: 6: 8 |
192.00000 |
0.075777583 |
0.025087284 |
1.2958340 |
3.0205575 |
332.35781 |
0.11035156 |
795027968 |
|
 Dashed lines show average rate (and +/- 1 sigma standard deviation) for this source (derived from this plot)
Daily light curves: FITS version ASCII version Orbit light curves: FITS version ASCII version
Dashed lines show average rate (and +/- 1 sigma standard deviation) for this source (derived from this plot)
Daily light curves: FITS version ASCII version Orbit light curves: FITS version ASCII version
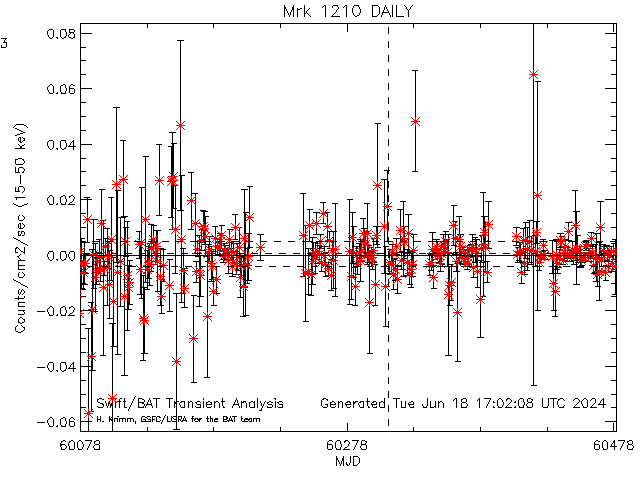
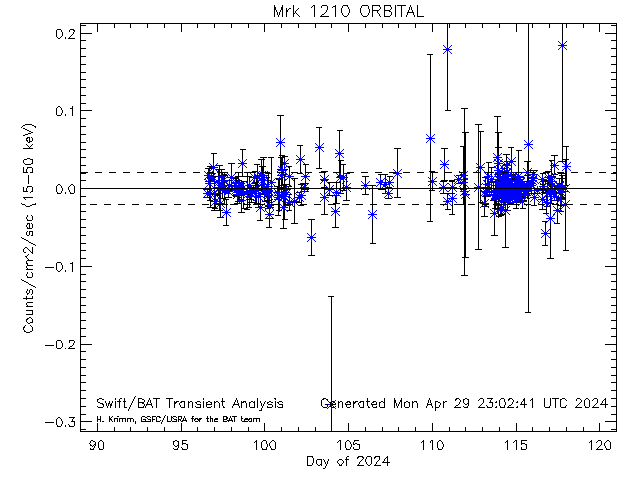
FLAG (POINTING)--Mrk1210
Mrk 1210 [33971] RA= 121.024 degs; Dec= 5.11400
mean: 0.000480 sdev: 0.021236 thresh: 0.064189 max: 0.216660
--SCALED MAP--(1.00000/41.0000)=(2.43902)--3-SIGMA=(0.13)--------------------------
Possible outbursts for Mrk 1210
| |
Count |
UTC Date |
Duration |
Rate |
Error |
Factor |
SNR |
mCrab |
Pcodefr |
MET |
| POINTING |
0 |
2026: 70:18:11:44 |
192.00000 |
0.10588297 |
0.021597384 |
1.6495590 |
4.9025832 |
464.39898 |
0.20312500 |
794945504 |
|
 Dashed lines show average rate (and +/- 1 sigma standard deviation) for this source (derived from this plot)
Daily light curves: FITS version ASCII version Orbit light curves: FITS version ASCII version
Dashed lines show average rate (and +/- 1 sigma standard deviation) for this source (derived from this plot)
Daily light curves: FITS version ASCII version Orbit light curves: FITS version ASCII version
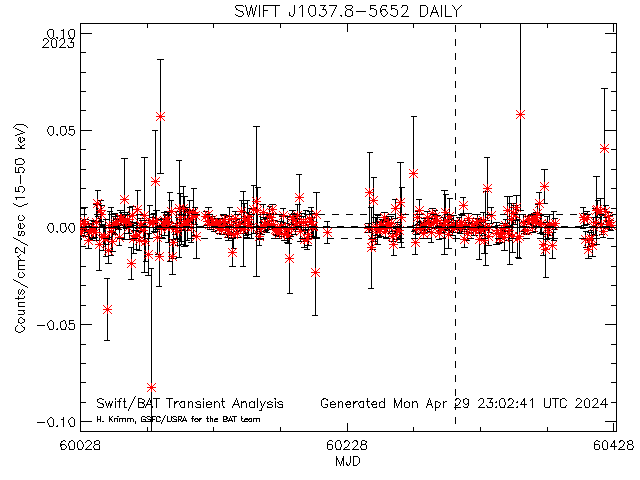
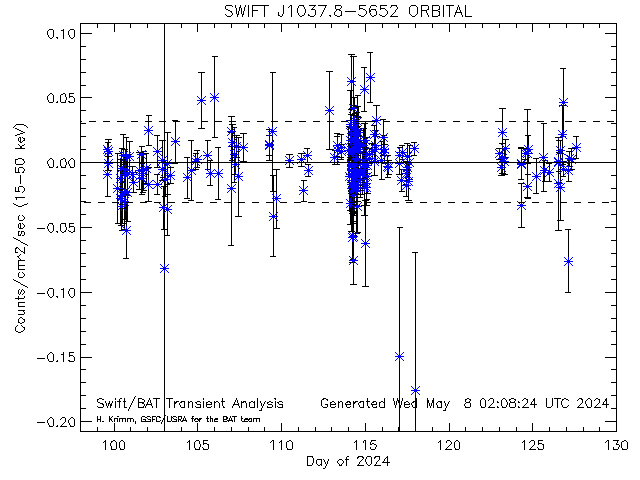
FLAG (EXPOSURE)--SWIFTJ1037.8-5652
SWIFT J1037.8-5652 [34043] RA= 159.398 degs; Dec= -56.8030
mean: 0.000515 sdev: 0.032014 thresh: 0.090175 max: 0.090175
--SCALED MAP--(1.00000/150.000)=(0.666667)--3-SIGMA=(0.13)--------------------------
Possible outbursts for SWIFT J1037.8-5652
| |
Count |
UTC Date |
Duration |
Rate |
Error |
Factor |
SNR |
mCrab |
Pcodefr |
MET |
| EXPOSURE |
0 |
2026: 72:13:47:52 |
64.000000 |
0.10293876 |
0.020555343 |
1.1415468 |
5.0078832 |
451.48577 |
0.37890625 |
795102472 |
|
 Dashed lines show average rate (and +/- 1 sigma standard deviation) for this source (derived from this plot)
Daily light curves: FITS version ASCII version Orbit light curves: FITS version ASCII version
Dashed lines show average rate (and +/- 1 sigma standard deviation) for this source (derived from this plot)
Daily light curves: FITS version ASCII version Orbit light curves: FITS version ASCII version
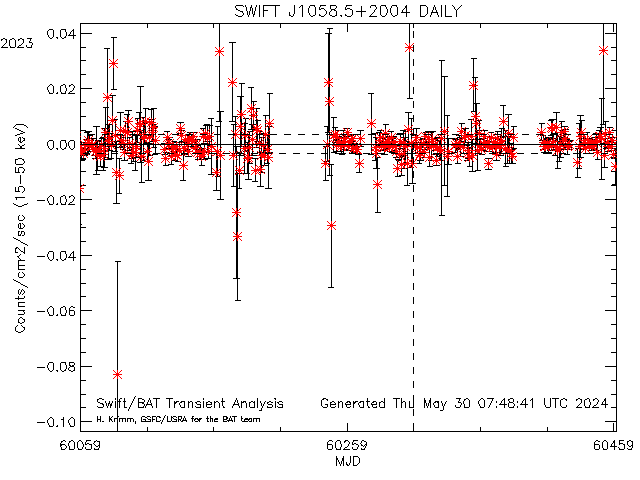
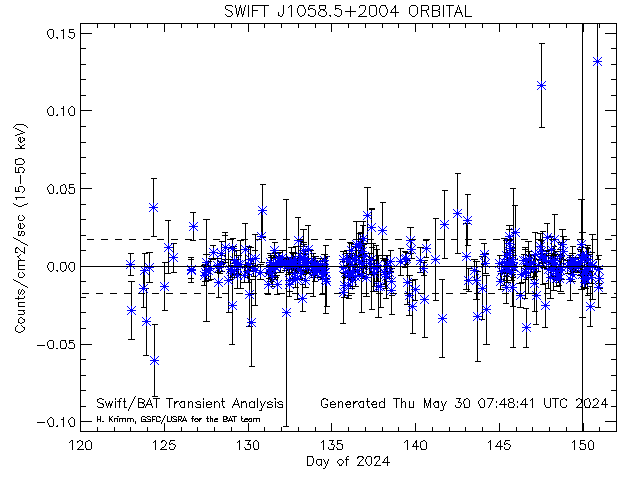
FLAG (DAILY)--SWIFTJ1058.5+2004
SWIFT J1058.5+2004 [33591] RA= 164.622 degs; Dec= 20.0672
mean: 0.000005 sdev: 0.003655 thresh: 0.010969 max: 0.044149
--SCALED MAP--(1.00000/31.0000)=(0.817996)--3-SIGMA=(0.13)--------------------------
Possible outbursts for SWIFT J1058.5+2004
| |
Count |
UTC Date |
MJD |
Rate |
Error |
Factor |
SNR |
mCrab |
| DAILY |
0 |
2026: 73 |
61113.000 |
0.012271265 |
0.0030480552 |
1.1187067 |
4.0259327 |
53.821337 |
|
 Dashed lines show average rate (and +/- 1 sigma standard deviation) for this source (derived from this plot)
Daily light curves: FITS version ASCII version Orbit light curves: FITS version ASCII version
Dashed lines show average rate (and +/- 1 sigma standard deviation) for this source (derived from this plot)
Daily light curves: FITS version ASCII version Orbit light curves: FITS version ASCII version
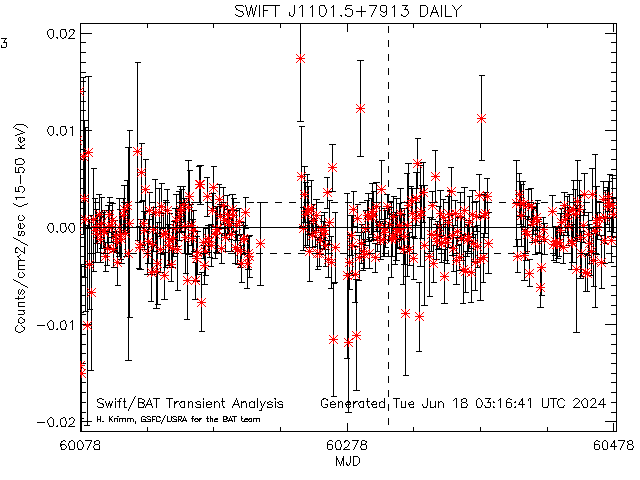
FLAG (EXPOSURE)--SWIFTJ1101.5+7913
SWIFT J1101.5+7913 [34056] RA= 165.378 degs; Dec= 79.2170
mean:-0.000051 sdev: 0.022297 thresh: 0.031546 max: 0.031546
--SCALED MAP--(2.00000/270.000)=(0.740741)--3-SIGMA=(0.13)--------------------------
Possible outbursts for SWIFT J1101.5+7913
| |
Count |
UTC Date |
Duration |
Rate |
Error |
Factor |
SNR |
mCrab |
Pcodefr |
MET |
| EXPOSURE |
0 |
2026: 71:12:52:24 |
64.000000 |
0.046870640 |
0.012699485 |
1.4857715 |
3.6907513 |
205.57298 |
0.48828125 |
795012744 |
| EXPOSURE |
1 |
2026: 71:12:52:24 |
64.000000 |
0.046872756 |
0.012699626 |
1.4858385 |
3.6908768 |
205.58226 |
0.48828125 |
795012744 |
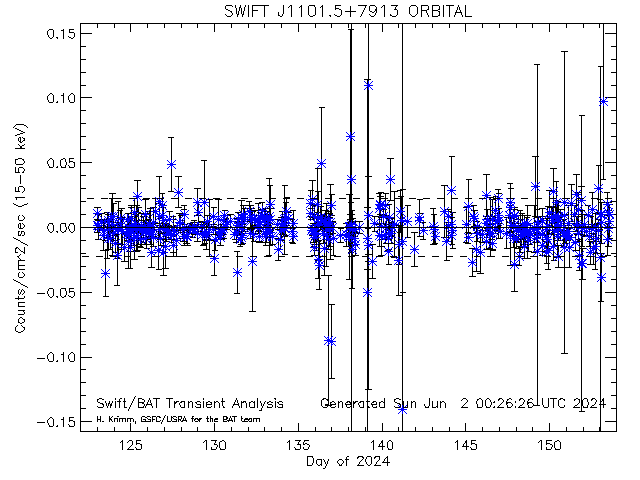
FLAG (POINTING)--SWIFTJ1101.5+7913
SWIFT J1101.5+7913 [34056] RA= 165.378 degs; Dec= 79.2170
mean:-0.000051 sdev: 0.022297 thresh: 0.031546 max: 0.031546
--SCALED MAP--(1.00000/92.0000)=(1.08696)--3-SIGMA=(0.13)--------------------------
Possible outbursts for SWIFT J1101.5+7913
| |
Count |
UTC Date |
Duration |
Rate |
Error |
Factor |
SNR |
mCrab |
Pcodefr |
MET |
| POINTING |
0 |
2026: 71:12:51:20 |
192.00000 |
0.034873206 |
0.0075931164 |
1.1054599 |
4.5927395 |
152.95265 |
0.48828125 |
795012680 |
|
 Dashed lines show average rate (and +/- 1 sigma standard deviation) for this source (derived from this plot)
Daily light curves: FITS version ASCII version Orbit light curves: FITS version ASCII version
Dashed lines show average rate (and +/- 1 sigma standard deviation) for this source (derived from this plot)
Daily light curves: FITS version ASCII version Orbit light curves: FITS version ASCII version
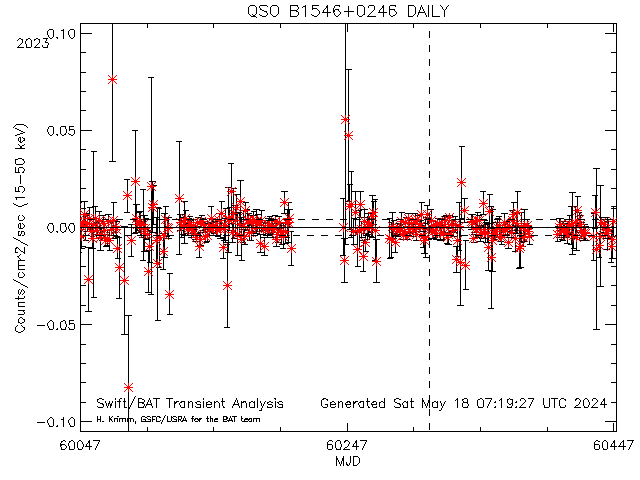
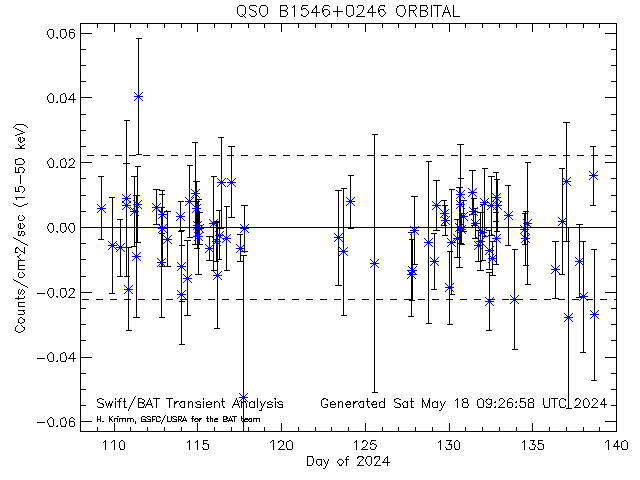
FLAG (DAILY)--QSOB1546+0246
QSO B1546+0246 [33084] RA= 237.373 degs; Dec= 2.61699
mean: 0.000016 sdev: 0.004382 thresh: 0.013162 max: 0.076310
--SCALED MAP--(1.00000/31.0000)=(0.775416)--3-SIGMA=(0.13)--------------------------
Possible outbursts for QSO B1546+0246
| |
Count |
UTC Date |
MJD |
Rate |
Error |
Factor |
SNR |
mCrab |
| DAILY |
0 |
2026: 73 |
61113.000 |
0.014789639 |
0.0034539550 |
1.1236930 |
4.2819431 |
64.866836 |
|
 Dashed lines show average rate (and +/- 1 sigma standard deviation) for this source (derived from this plot)
Daily light curves: FITS version ASCII version Orbit light curves: FITS version ASCII version
Dashed lines show average rate (and +/- 1 sigma standard deviation) for this source (derived from this plot)
Daily light curves: FITS version ASCII version Orbit light curves: FITS version ASCII version
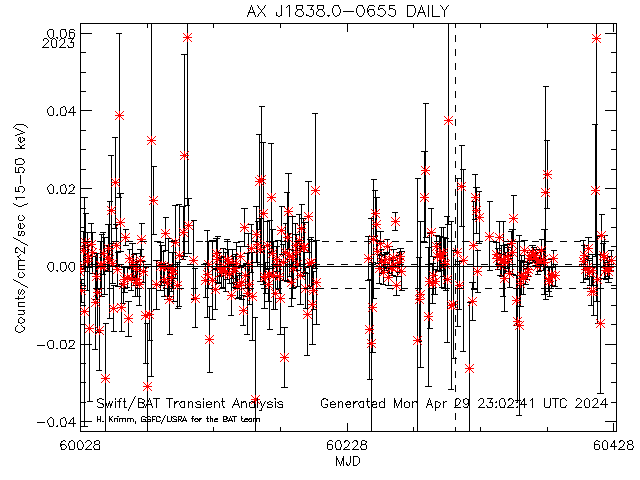
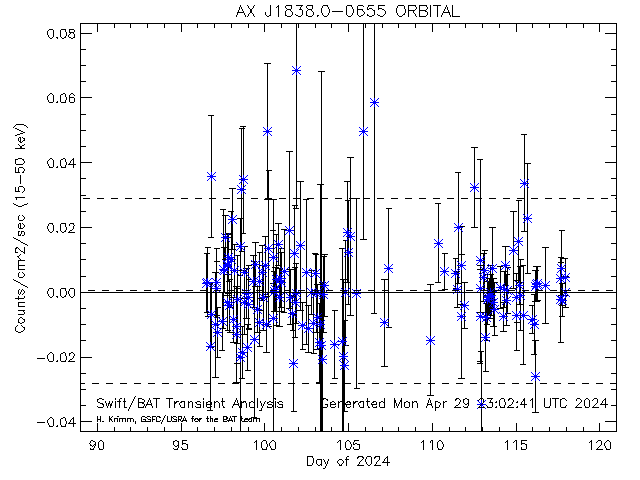
FLAG (POINTING)--AXJ1838.0-0655
AX J1838.0-0655 [10596] RA= 279.513 degs; Dec= -6.92600
mean: 0.000380 sdev: 0.028506 thresh: 0.085898 max: 0.124555
--SCALED MAP--(1.00000/2.00000)=(50.0000)--3-SIGMA=(0.13)--------------------------
Possible outbursts for AX J1838.0-0655
| |
Count |
UTC Date |
Duration |
Rate |
Error |
Factor |
SNR |
mCrab |
Pcodefr |
MET |
| POINTING |
0 |
2026: 72:10:52: 0 |
192.00000 |
0.12455460 |
0.021693472 |
1.4500238 |
5.7415706 |
546.29211 |
0.19335938 |
795091920 |
FLAG (DAILY)--AXJ1838.0-0655
AX J1838.0-0655 [10596] RA= 279.513 degs; Dec= -6.92600
mean: 0.000381 sdev: 0.004429 thresh: 0.013667 max: 0.124555
--SCALED MAP--(1.00000/31.0000)=(1.05644)--3-SIGMA=(0.13)--------------------------
Possible outbursts for AX J1838.0-0655
| |
Count |
UTC Date |
MJD |
Rate |
Error |
Factor |
SNR |
mCrab |
| DAILY |
0 |
2026: 75 |
61115.000 |
0.12455460 |
0.021693472 |
9.1135802 |
5.7415706 |
546.29211 |
|
 Dashed lines show average rate (and +/- 1 sigma standard deviation) for this source (derived from this plot)
Daily light curves: FITS version ASCII version Orbit light curves: FITS version ASCII version
Dashed lines show average rate (and +/- 1 sigma standard deviation) for this source (derived from this plot)
Daily light curves: FITS version ASCII version Orbit light curves: FITS version ASCII version
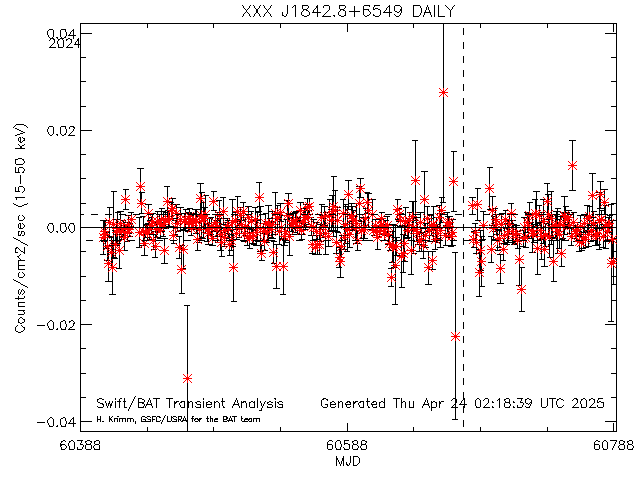
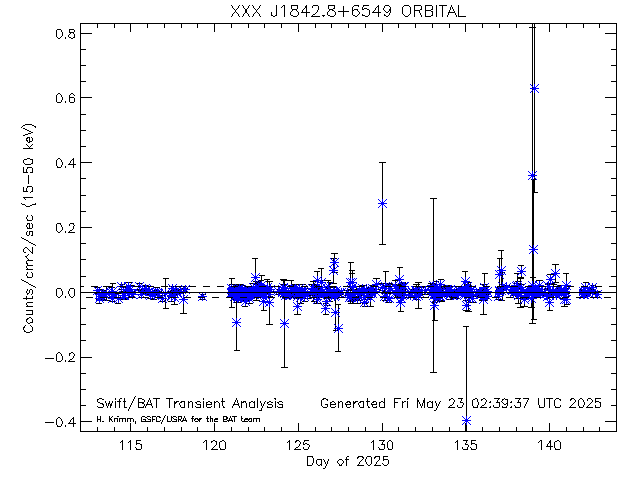
FLAG (POINTING)--XXXJ1842.8+6549
XXX J1842.8+6549 [30089] RA= 280.698 degs; Dec= 65.8180
mean:-0.000016 sdev: 0.017092 thresh: 0.027828 max: 0.027828
--SCALED MAP--(2.00000/139.000)=(1.43885)--3-SIGMA=(0.13)--------------------------
Possible outbursts for XXX J1842.8+6549
| |
Count |
UTC Date |
Duration |
Rate |
Error |
Factor |
SNR |
mCrab |
Pcodefr |
MET |
| POINTING |
0 |
2026: 71:17:55:52 |
144.00000 |
0.037289061 |
0.0097222531 |
1.3400049 |
3.8354341 |
163.54851 |
0.57031250 |
795030952 |
| POINTING |
1 |
2026: 72: 1:37: 4 |
192.00000 |
0.035088442 |
0.0088744999 |
1.2609244 |
3.9538501 |
153.89667 |
0.45312500 |
795058624 |
|
 Dashed lines show average rate (and +/- 1 sigma standard deviation) for this source (derived from this plot)
Daily light curves: FITS version ASCII version Orbit light curves: FITS version ASCII version
Dashed lines show average rate (and +/- 1 sigma standard deviation) for this source (derived from this plot)
Daily light curves: FITS version ASCII version Orbit light curves: FITS version ASCII version
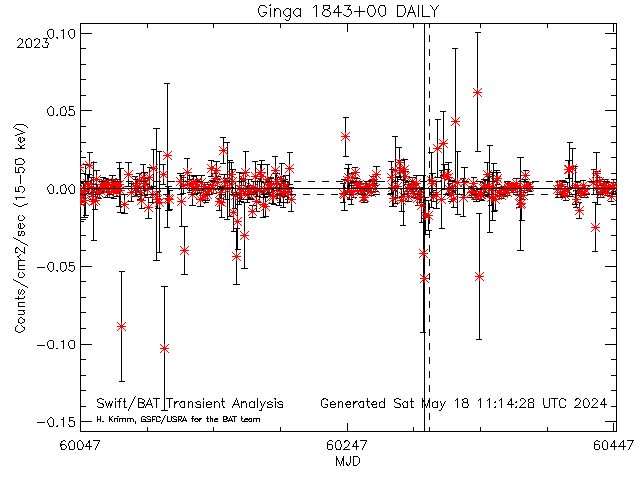
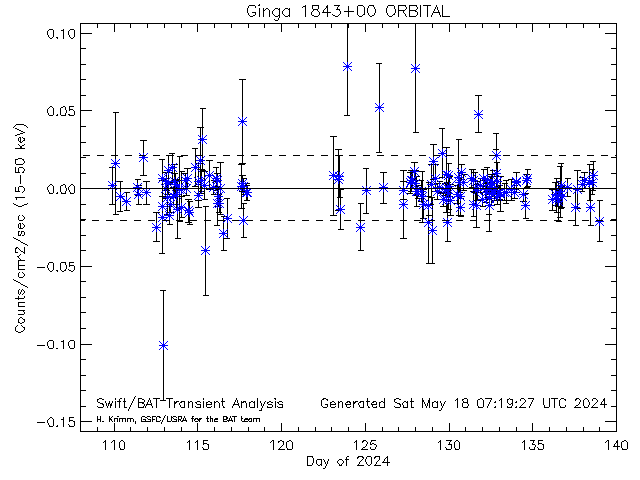
FLAG (EXPOSURE)--Ginga1843+00
Ginga 1843+00 [10563] RA= 281.404 degs; Dec= 0.863000
mean: 0.000347 sdev: 0.021159 thresh: 0.063824 max: 0.085638
--SCALED MAP--(10.0000/45.0000)=(22.2222)--3-SIGMA=(0.13)--------------------------
Possible outbursts for Ginga 1843+00
| |
Count |
UTC Date |
Duration |
Rate |
Error |
Factor |
SNR |
mCrab |
Pcodefr |
MET |
| EXPOSURE |
0 |
2026: 70:19:11:36 |
64.000000 |
0.078972433 |
0.022443082 |
1.2373533 |
3.5187873 |
346.37031 |
0.31250000 |
794949096 |
| EXPOSURE |
1 |
2026: 70:19:11:36 |
64.000000 |
0.078972466 |
0.022442988 |
1.2373539 |
3.5188036 |
346.37046 |
0.31250000 |
794949096 |
| EXPOSURE |
2 |
2026: 71:22:53:28 |
64.000000 |
0.17238218 |
0.032474434 |
2.7009130 |
5.3082428 |
756.06219 |
0.18945312 |
795048808 |
| EXPOSURE |
3 |
2026: 71:22:54:32 |
88.000000 |
0.11847955 |
0.030454154 |
1.8563575 |
3.8904234 |
519.64715 |
0.18945312 |
795048872 |
| EXPOSURE |
4 |
2026: 72: 1:58:24 |
64.000000 |
0.12391557 |
0.033116312 |
1.9415300 |
3.7418288 |
543.48934 |
0.19140625 |
795059904 |
| EXPOSURE |
5 |
2026: 72: 3:31:28 |
64.000000 |
0.12058373 |
0.033301352 |
1.8893261 |
3.6209861 |
528.87600 |
0.19335938 |
795065488 |
| EXPOSURE |
6 |
2026: 72: 5: 3:28 |
64.000000 |
0.13249118 |
0.032136093 |
2.0758941 |
4.1228155 |
581.10167 |
0.19335938 |
795071008 |
| EXPOSURE |
7 |
2026: 72: 5: 4:32 |
64.000000 |
0.11425622 |
0.030373083 |
1.7901857 |
3.7617592 |
501.12377 |
0.19335938 |
795071072 |
| EXPOSURE |
8 |
2026: 72: 6:35:28 |
80.000000 |
0.10903200 |
0.029074663 |
1.7083317 |
3.7500692 |
478.21051 |
0.19140625 |
795076528 |
| EXPOSURE |
9 |
2026: 72: 6:37:52 |
64.000000 |
0.11562314 |
0.030912229 |
1.8116028 |
3.7403691 |
507.11904 |
0.19140625 |
795076672 |
FLAG (POINTING)--Ginga1843+00
Ginga 1843+00 [10563] RA= 281.404 degs; Dec= 0.863000
mean: 0.000347 sdev: 0.021159 thresh: 0.063824 max: 0.085638
--SCALED MAP--(7.00000/15.0000)=(46.6667)--3-SIGMA=(0.13)--------------------------
Possible outbursts for Ginga 1843+00
| |
Count |
UTC Date |
Duration |
Rate |
Error |
Factor |
SNR |
mCrab |
Pcodefr |
MET |
| POINTING |
0 |
2026: 71:18:12:32 |
200.00000 |
0.10145408 |
0.025916512 |
1.5895996 |
3.9146503 |
444.97403 |
0.17578125 |
795031952 |
| POINTING |
1 |
2026: 71:22:53:28 |
152.00000 |
0.14409065 |
0.022696482 |
2.2576364 |
6.3485894 |
631.97650 |
0.18945312 |
795048808 |
| POINTING |
2 |
2026: 72: 1:58:24 |
192.00000 |
0.097390844 |
0.019321900 |
1.5259361 |
5.0404383 |
427.15282 |
0.19140625 |
795059904 |
| POINTING |
3 |
2026: 72: 3:31:28 |
192.00000 |
0.096811423 |
0.019217627 |
1.5168576 |
5.0376368 |
424.61150 |
0.19335938 |
795065488 |
| POINTING |
4 |
2026: 72: 5: 3:28 |
192.00000 |
0.10926420 |
0.018456435 |
1.7119699 |
5.9201143 |
479.22895 |
0.19335938 |
795071008 |
| POINTING |
5 |
2026: 72: 6:35:28 |
208.00000 |
0.10308234 |
0.018092039 |
1.6151114 |
5.6976630 |
452.11552 |
0.19140625 |
795076528 |
| POINTING |
6 |
2026: 72: 8: 7:28 |
192.00000 |
0.097646382 |
0.019763283 |
1.5299399 |
4.9407976 |
428.27360 |
0.19335938 |
795082048 |
FLAG (DAILY)--Ginga1843+00
Ginga 1843+00 [10563] RA= 281.404 degs; Dec= 0.863000
mean: 0.000317 sdev: 0.004810 thresh: 0.014747 max: 0.085638
--SCALED MAP--(3.00000/31.0000)=(0.730450)--3-SIGMA=(0.13)--------------------------
Possible outbursts for Ginga 1843+00
| |
Count |
UTC Date |
MJD |
Rate |
Error |
Factor |
SNR |
mCrab |
| DAILY |
0 |
2026: 73 |
61113.000 |
0.056132781 |
0.0084648185 |
3.8063322 |
6.6313036 |
246.19641 |
| DAILY |
1 |
2026: 74 |
61114.000 |
0.082273946 |
0.012072404 |
5.5789498 |
6.8150423 |
360.85063 |
| DAILY |
2 |
2026: 75 |
61115.000 |
0.085638250 |
0.0080603179 |
5.8070814 |
10.624674 |
375.60635 |
|
 Dashed lines show average rate (and +/- 1 sigma standard deviation) for this source (derived from this plot)
Daily light curves: FITS version ASCII version Orbit light curves: FITS version ASCII version
Dashed lines show average rate (and +/- 1 sigma standard deviation) for this source (derived from this plot)
Daily light curves: FITS version ASCII version Orbit light curves: FITS version ASCII version
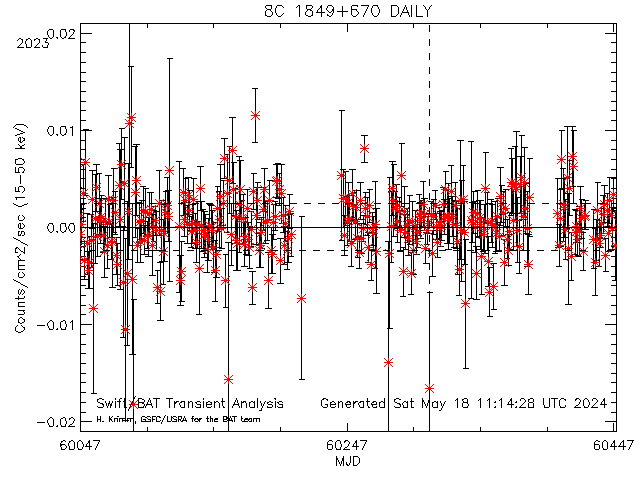
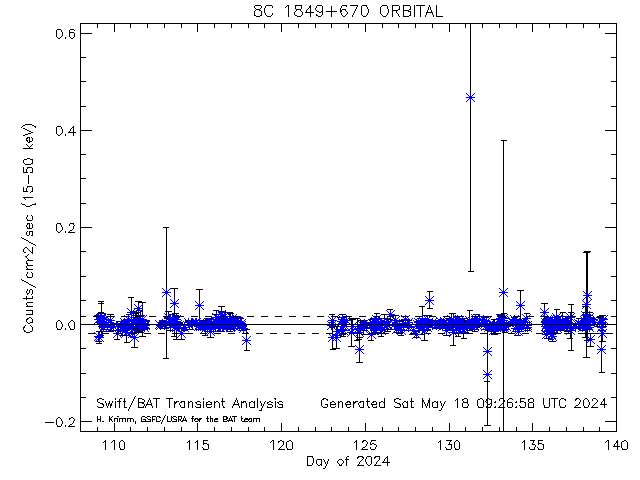
FLAG (POINTING)--8C1849+670
8C 1849+670 [33104] RA= 282.317 degs; Dec= 67.0949
mean: 0.000043 sdev: 0.017868 thresh: 0.028150 max: 0.028150
--SCALED MAP--(2.00000/134.000)=(1.49254)--3-SIGMA=(0.13)--------------------------
Possible outbursts for 8C 1849+670
| |
Count |
UTC Date |
Duration |
Rate |
Error |
Factor |
SNR |
mCrab |
Pcodefr |
MET |
| POINTING |
0 |
2026: 71: 5:58:48 |
192.00000 |
0.054578193 |
0.016629228 |
1.9388478 |
3.2820643 |
239.37804 |
0.14648438 |
794987928 |
| POINTING |
1 |
2026: 71:16:53: 4 |
192.00000 |
0.050787648 |
0.016455594 |
1.8041916 |
3.0863454 |
222.75284 |
0.13671875 |
795027184 |
|
 Dashed lines show average rate (and +/- 1 sigma standard deviation) for this source (derived from this plot)
Daily light curves: FITS version ASCII version Orbit light curves: FITS version ASCII version
Dashed lines show average rate (and +/- 1 sigma standard deviation) for this source (derived from this plot)
Daily light curves: FITS version ASCII version Orbit light curves: FITS version ASCII version
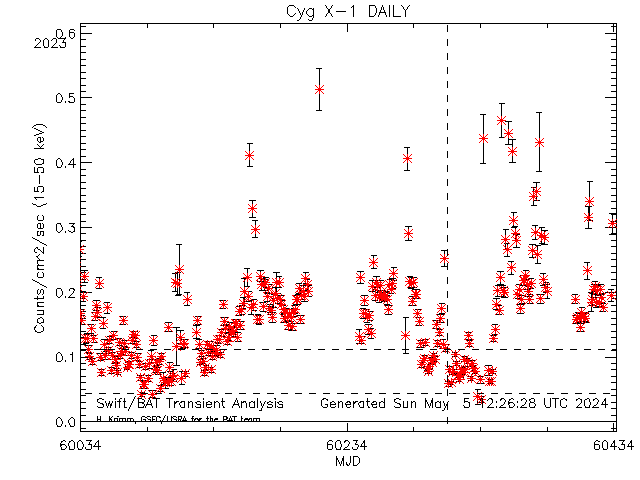
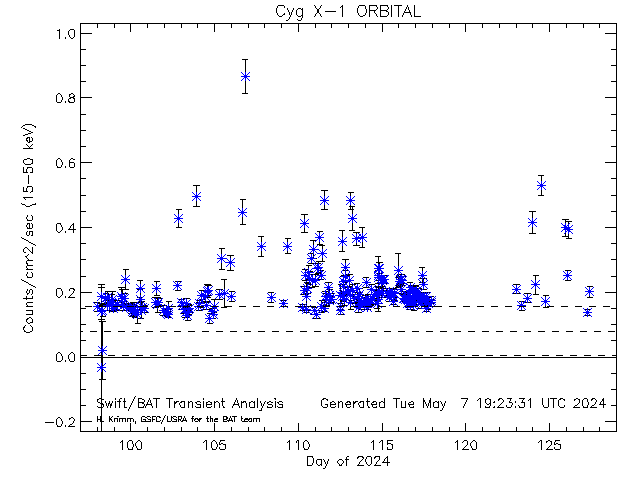
FLAG (EXPOSURE)--CygX-1
Cyg X-1 [10002] RA= 299.591 degs; Dec= 35.2020
mean: 0.081499 sdev: 0.081793 thresh: 0.326879 max: 0.715070
--SCALED MAP--(1.00000/211.000)=(0.473934)--3-SIGMA=(0.13)--------------------------
Possible outbursts for Cyg X-1
| |
Count |
UTC Date |
Duration |
Rate |
Error |
Factor |
SNR |
mCrab |
Pcodefr |
MET |
| EXPOSURE |
0 |
2026: 71:16:49:52 |
112.00000 |
0.60201822 |
0.053333727 |
1.8417133 |
11.287758 |
2640.4308 |
0.21658748 |
795026992 |
|
 Dashed lines show average rate (and +/- 1 sigma standard deviation) for this source (derived from this plot)
Daily light curves: FITS version ASCII version Orbit light curves: FITS version ASCII version
Dashed lines show average rate (and +/- 1 sigma standard deviation) for this source (derived from this plot)
Daily light curves: FITS version ASCII version Orbit light curves: FITS version ASCII version
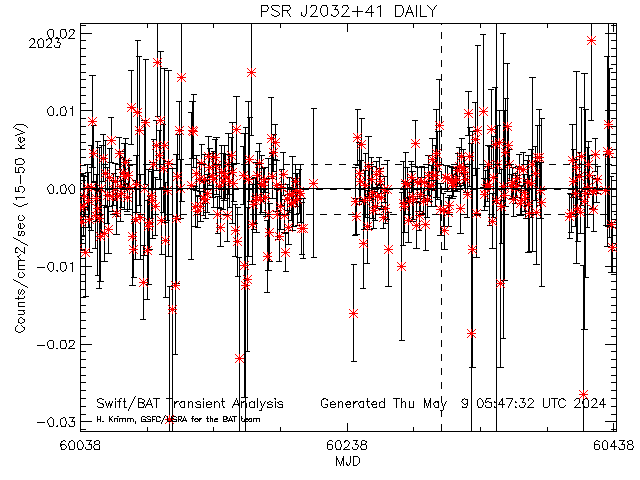
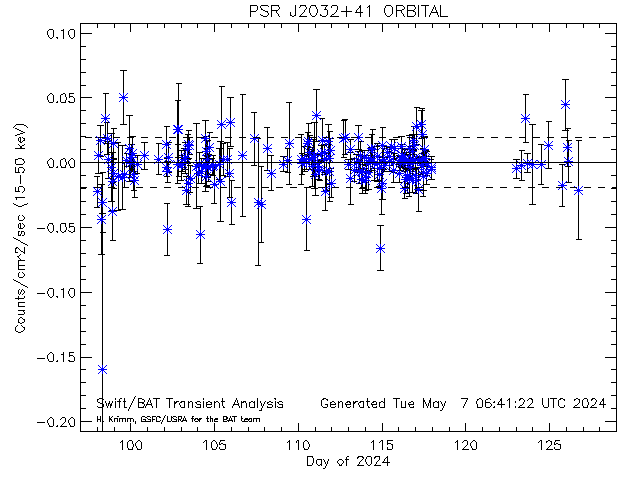
FLAG (POINTING)--PSRJ2032+41
PSR J2032+41 [34141] RA= 308.058 degs; Dec= 41.3760
mean:-0.000050 sdev: 0.020660 thresh: 0.027241 max: 0.027241
--SCALED MAP--(1.00000/91.0000)=(1.09890)--3-SIGMA=(0.13)--------------------------
Possible outbursts for PSR J2032+41
| |
Count |
UTC Date |
Duration |
Rate |
Error |
Factor |
SNR |
mCrab |
Pcodefr |
MET |
| POINTING |
0 |
2026: 71: 1:13:36 |
200.00000 |
0.035969982 |
0.0074551377 |
1.3204231 |
4.8248581 |
157.76307 |
0.63281250 |
794970816 |
|
 Dashed lines show average rate (and +/- 1 sigma standard deviation) for this source (derived from this plot)
Daily light curves: FITS version ASCII version Orbit light curves: FITS version ASCII version
Dashed lines show average rate (and +/- 1 sigma standard deviation) for this source (derived from this plot)
Daily light curves: FITS version ASCII version Orbit light curves: FITS version ASCII version
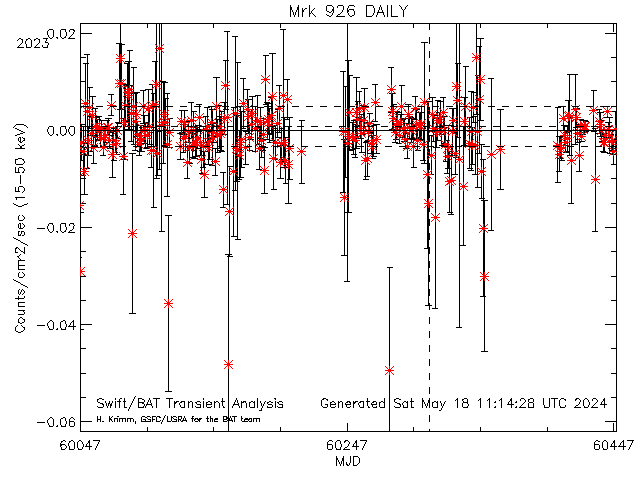
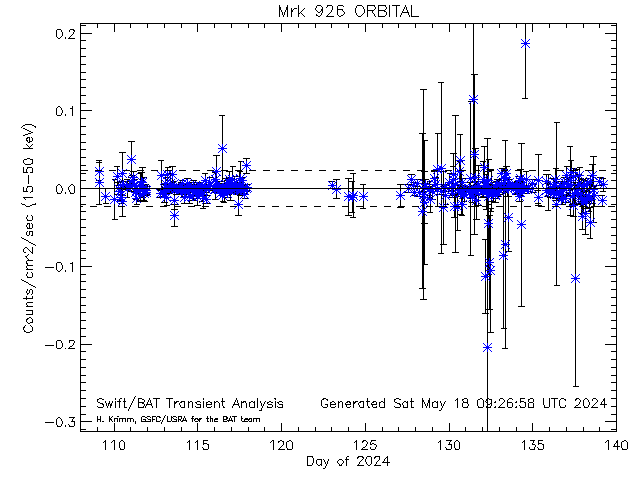
FLAG (DAILY)--Mrk926
Mrk 926 [20179] RA= 346.181 degs; Dec= -8.68572
mean: 0.000763 sdev: 0.004601 thresh: 0.014566 max: 0.116248
--SCALED MAP--(1.00000/31.0000)=(0.807857)--3-SIGMA=(0.13)--------------------------
Possible outbursts for Mrk 926
| |
Count |
UTC Date |
MJD |
Rate |
Error |
Factor |
SNR |
mCrab |
| DAILY |
0 |
2026: 75 |
61115.000 |
0.031080135 |
0.0069870616 |
2.1337776 |
4.4482411 |
136.31638 |
|
 Dashed lines show average rate (and +/- 1 sigma standard deviation) for this source (derived from this plot)
Daily light curves: FITS version ASCII version Orbit light curves: FITS version ASCII version
Dashed lines show average rate (and +/- 1 sigma standard deviation) for this source (derived from this plot)
Daily light curves: FITS version ASCII version Orbit light curves: FITS version ASCII version
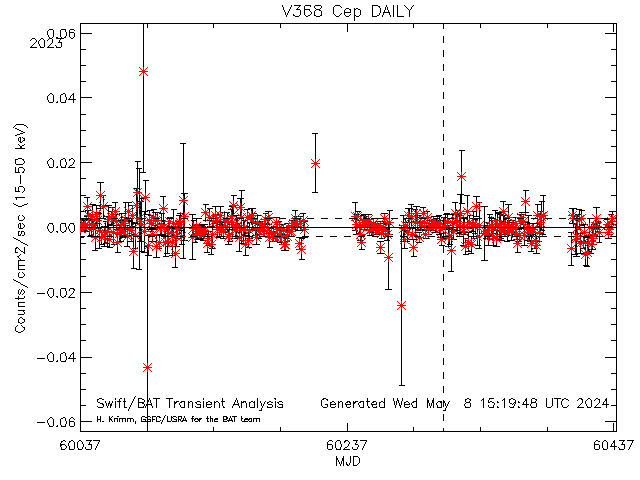
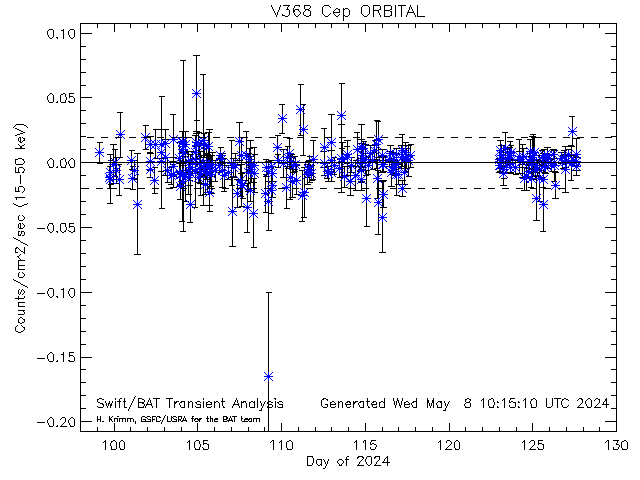
FLAG (POINTING)--V368Cep
V368 Cep [30203] RA= 349.861 degs; Dec= 79.0036
mean: 0.000013 sdev: 0.020952 thresh: 0.051321 max: 0.051321
--SCALED MAP--(1.00000/146.000)=(0.684932)--3-SIGMA=(0.13)--------------------------
Possible outbursts for V368 Cep
| |
Count |
UTC Date |
Duration |
Rate |
Error |
Factor |
SNR |
mCrab |
Pcodefr |
MET |
| POINTING |
0 |
2026: 71:19:59:52 |
128.00000 |
0.071663340 |
0.016676930 |
1.3963627 |
4.2971543 |
314.31289 |
0.21679688 |
795038392 |
This page was last modified on Sun Mar 15 22:04:30 UTC 2026