Creating 3-Color Images
Overview:
If you intend to visualize both the energy and intensity in astronomical images, a 3-color image might be a good solution, especially if intended for the general audience or public/press releases. This page describes how to create 3-color images from both UVOT and XRT data, or from a combination of UVOT and XRT data.
Read this thread if you want to: Create "true" 3-color images in different energy and intensity scales.
Last update: Nov 27, 2005
3-color images can be created in various ways. Some of the more common
methods are described below.
This thread assumes that you have created three FITS files in three
different filers (UVOT) or energy bands (XRT).
1. DS9:
SAOImage DS9 is an astronomical data visualization application for files in FITS format. It consists of a set of GUI application available for most computer platforms and provides visualization support for a number of popular astronomical analysis software packages, such as the Swift FTOOLS.
You can use DS9 either in command-line mode or in GUI mode to create 3-color images.
Command-line mode: In your terminal execute the command
| ds9 -rgb -red <red image.fits> -green <green image.fits> -blue <blue image.fits> |
The 3-color image will be visible in the main DS9 display, while a pop-up "RGB" window gives you control over the currently selected image to adjust levels, scales, etc., in the main window.
After the right scale and levels have been selected, click on "File" in the main menu and next on "Save Image as". Your can chose between different file formats such as JPEG and TIFF. If you want to create a Postscript file, click on "File" and then on "Print". Chose "Print to File" and enter a file name (the default will be "ds9.ps"). If you intend to create 3-color images for print media, select a resolution of 300 dpi and check the "Interpolate" button. Many journals and newspapers request 4-color files (CMYK) for reproduction, which requires that you click on the "CMYK" button. Since your computer screen is only able to display 3 colors, make sure to make test printouts on a 4-color printer to check the results.
GUI mode: You can also simply start the DS9 application, then click on "Frame" and "New Frame RGB". The "RGB" window will pop up. Select the "Red" channel in the "RGB" window, click on "File" and "Open" in the main DS9 window to load your red image. Do the same for the green and blue channels.
In both cases you can overlay source markers and text using DS9 region files.
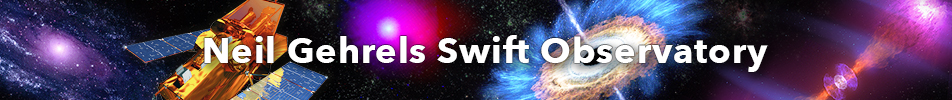
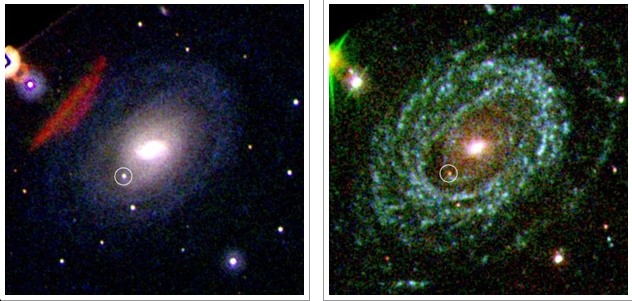
The example below shows UVOT 3-color images of SN2005ke/NGC3173 from summed V, B, U, and
UVW1, UVM2, and UVW2 images, created with the commands
| $ ds9 -rgb -red uvv_sum.fits -green ubb_sum.fits -blue uuu_sum.fits -region circle.reg |
| $ ds9 -rgb -red uw1_sum.fits -green um2_sum.fits -blue uw2_sum.fits -region circle.reg |
2. Photoshop and FITS Liberator:
The FITS Liberator is an increasingly popular plugin for Adobe Photoshop to create "press-ready" color images from FITS files.
The Adobe Photoshop is a commercial product which offers a wide range of image editing capabilities. The wider range of image manipulation tools, such as stretchable image scales, makes the FITS Liberator a superior tool compared to the DS9. Please note that Adobe Photoshop is only available for Windows and Mac platforms. A FITS Liberator plugin for The Gimp, popular on Linux platforms, will not be available in the near future.
3. CIAO Tool "dmimg2jpg":
Experienced Chandra users might find it easy to create 3-color images using existing CIAO tools.
The Chandra Interactive Analysis Of Observation, CIAO, is a popular high-level data analysis package for the reduction of Chandra and other X-ray data. If you are familiar with CIAO, a fast way to create 3-color images is to follow this CIAO thread which creates a "true" 3-color image from any three files in FITS format (not only obtained from Chandra observations).
4. IDL Tools:
You can experiment with countless other tools, such as IDL image libraries.
For example, you can pass a 2-D image through the three color vectors that make up a color table.
IDL> thisDevice = !D.NAME |
Make sure the 2-D image data is scaled into the 256 colors. Next, create and fill up the 3D image array:
IDL> thisImage = BYTSCL(image) |
Finally, write the JPEG file using the WRITE_JPE
IDL> WRITE_JPEG, 'myimage.jpg', image3d, TRUE=1, QUALITY= |
JPEG uses a "lossy" compression scheme in which some of the original data can be lost
when the file is de-compressed. The "Quality" parameter sets the amount of information
you wish to keep. The default value is 75.