Due to the lapse in federal government funding, NASA is not updating this website. We sincerely regret this inconvenience.
SGR 1900+14
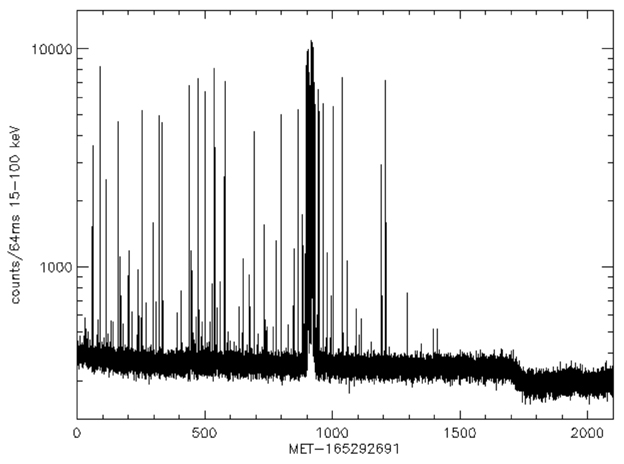
Detected source flux by BAT during period of intense activity of SGR 1900+14 on March 29 with 64 ms timescale. Horizontal zero of the plot (MET 165292691 = 2006-03-29 02:38:10) is the beginning of the observation. Some individual bursts (especially during the storm around +900 seconds in the plot) caused wrapping in the internal counters and so the vertical scale is truncated.
Detail of the storm plotted with 1ms timescale. Vertical axis is counts/ms ~12-100 keV. Horizontal zero of the plot is MET 165293500 = 2006-03-29 02:51:39. This is a wide plot and to view a larger version just click the figure. Once loaded, you may have to scroll your browser window to the right to see the entire figure.


