

UVOT
Standard Products
This page documents the UVOT standard products that are created for each
new Swift gamma-ray burst (GRB). The products are produced
automatically whenever more data from Segment 0 for
the GRB are processed at the SDC. The products are not made if there is no accurate position
for the afterglow. After all the data for Segment 0 have been processed, the results are
checked by a
UVOT scientist and, if correct, sent to the GCN, and posted on the
Swift Burst Ground Analysis
page.
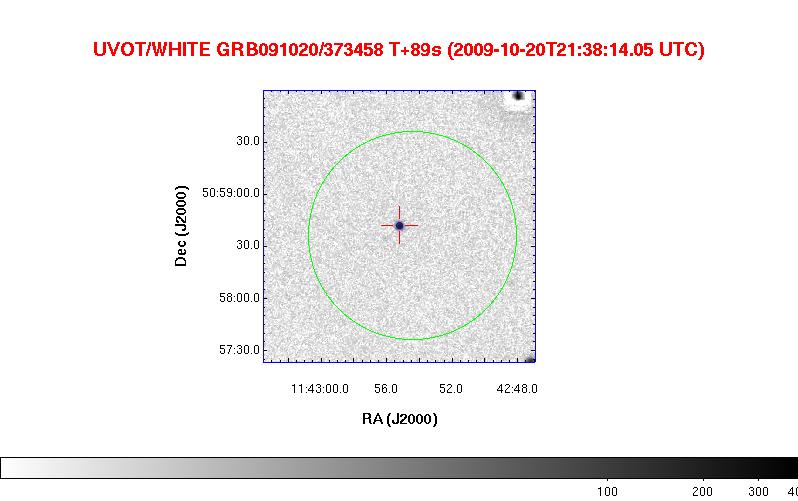
UVOT & DSS Thumbnails
The standard products include two small images (thumbnails)
centered at
the position of the GRB afterglow. One is taken from the first UVOT
finding chart, which is typically a 150-second exposure with the white
filter. If only a BAT position is available, then the image is 6' on a side.
Otherwise the image is 2' on a side.
The error circle for BAT is shown as a green circle,
and the XRT error circle is shown in blue. If available, UVOT positions
and ground-based optical positions are indicated with red and black
reticles respectively. The image is labelled with the filter used, the
date of the GRB, the trigger number, and the start time of the exposure
in both UTC and the delay from the burst trigger. The other image
is produced from the Digital Sky
Survey (DSS), which uses the same approach for displaying the BAT, XRT,
UVOT, and ground-based optical positions. An example of the UVOT image
is shown below.
Plots of Light Curves
The light curves are produced using the FTOOL uvotproduct. The source region is centered at the best known position for the GRB. A UVOT position is preferred, followed by a ground-based optical position, and finally the XRT position. If only a BAT position is available, no light curves are produced. The background region is an annulus centered at the source position with 6-arc second holes around detected sources removed. The magnitudes have all the usual corrections used in UVOT photometry (Poole et al. 2008). The plotted points show 1-σ error bars or 2-σ upper limits.
There are several situations in which the automated process will produce invalid results. An example is a source unrelated to the afterglow contributing counts to the source region. Another is a very bright source in or near the background region.
The light curves for the visible filters for GRB 091020 are shown below.
Other Information for Light Curves
If you have a question about Swift, please contact us via the Feedback form.